

Your website likely has hundreds of pages of content ranging from news stories and events to informational resources and staff profiles. It’s impossible to review all of it and constantly generate new content for each area. How do you decide where to focus your energy?
In today’s data-driven world, site owners can achieve better outcomes by basing their decisions on statistics and observed behavior rather than assumptions and personal preferences. Google Analytics is a powerful tool to increase your understanding of how people use your website. You can see what pages they visit most often, how they spend their time, and more. The results may often surprise you and lead you to reconsider your digital content strategy.
For users new to Google Analytics, the complex data in the reports can be overwhelming. Here are three ways you can get started using Google Analytics to make strategic decisions about your content.
1. Spruce up your most viewed pages
The Google Analytics Behavior reports will show you which pages on your website receive the most views (I’ll explain how to access these in a moment). Since you know many visitors are spending time on these pages, it would be a good idea to ensure they are making a good impression:
- Is the content up-to-date? Are there any typos or inaccuracies?
- Does the message align with your organization’s vision, mission, goals, and brand strategy?
- Does the page provide relevant next steps or links that invite users to explore your site further and take action to advance your mission?
Spending time on the top 10 or 15 pages will maximize the reach of your editorial efforts.
To find a list of the most frequently viewed pages on your site, log in to Google Analytics and follow these steps:
- Click on “Behavior” under “Reports” in the sidebar.
- Click on “Site Content” then “All Pages.”
- Adjust the date range at the top to include the last 6 months or 12 months of data. This way your data sample will account for seasonal fluctuations or other events that can cause spikes in web traffic.
- At the bottom of the data table where it says “Show rows,” increase the number to 25.
- Now look at the pages listed. The second column “Pageviews” shows how many times each page was viewed. A single user can look at the same page more than once during the same visit, or again during subsequent visits. The third column “Unique Pageviews” shows how many times each page was viewed if you don’t count those repeat visitors.

2. Add to your most popular section
Another approach is to identify the most popular section of your site, instead of focusing on individual pages. If a certain part of your site draws a large audience, consider optimizing that section rather than spending a lot of time on a section that most visitors overlook (even if it’s a bit stale).
For example, if 25% of your visitors view the staff directory, and only 8% visit the news section, you might want to put more effort into updating staff photos and biographies than creating news posts. Or if 55% of your pageviews are on your blog and only 10% on events, you might want to prioritize developing fresh blog content over creating robust event descriptions.
You can also take an opposite approach and try to increase the value of the sections that don’t garner as much attention. But what I’m suggesting here is leaning into your strengths.
To find the relative popularity of your site’s sections, the content needs to be organized consistently under paths or subfolders in the URL. If they aren’t organized this way, you could add custom dimensions to help with tracking the visits to related pages (but that’s beyond the scope of this article). In Google Analytics, do the following:
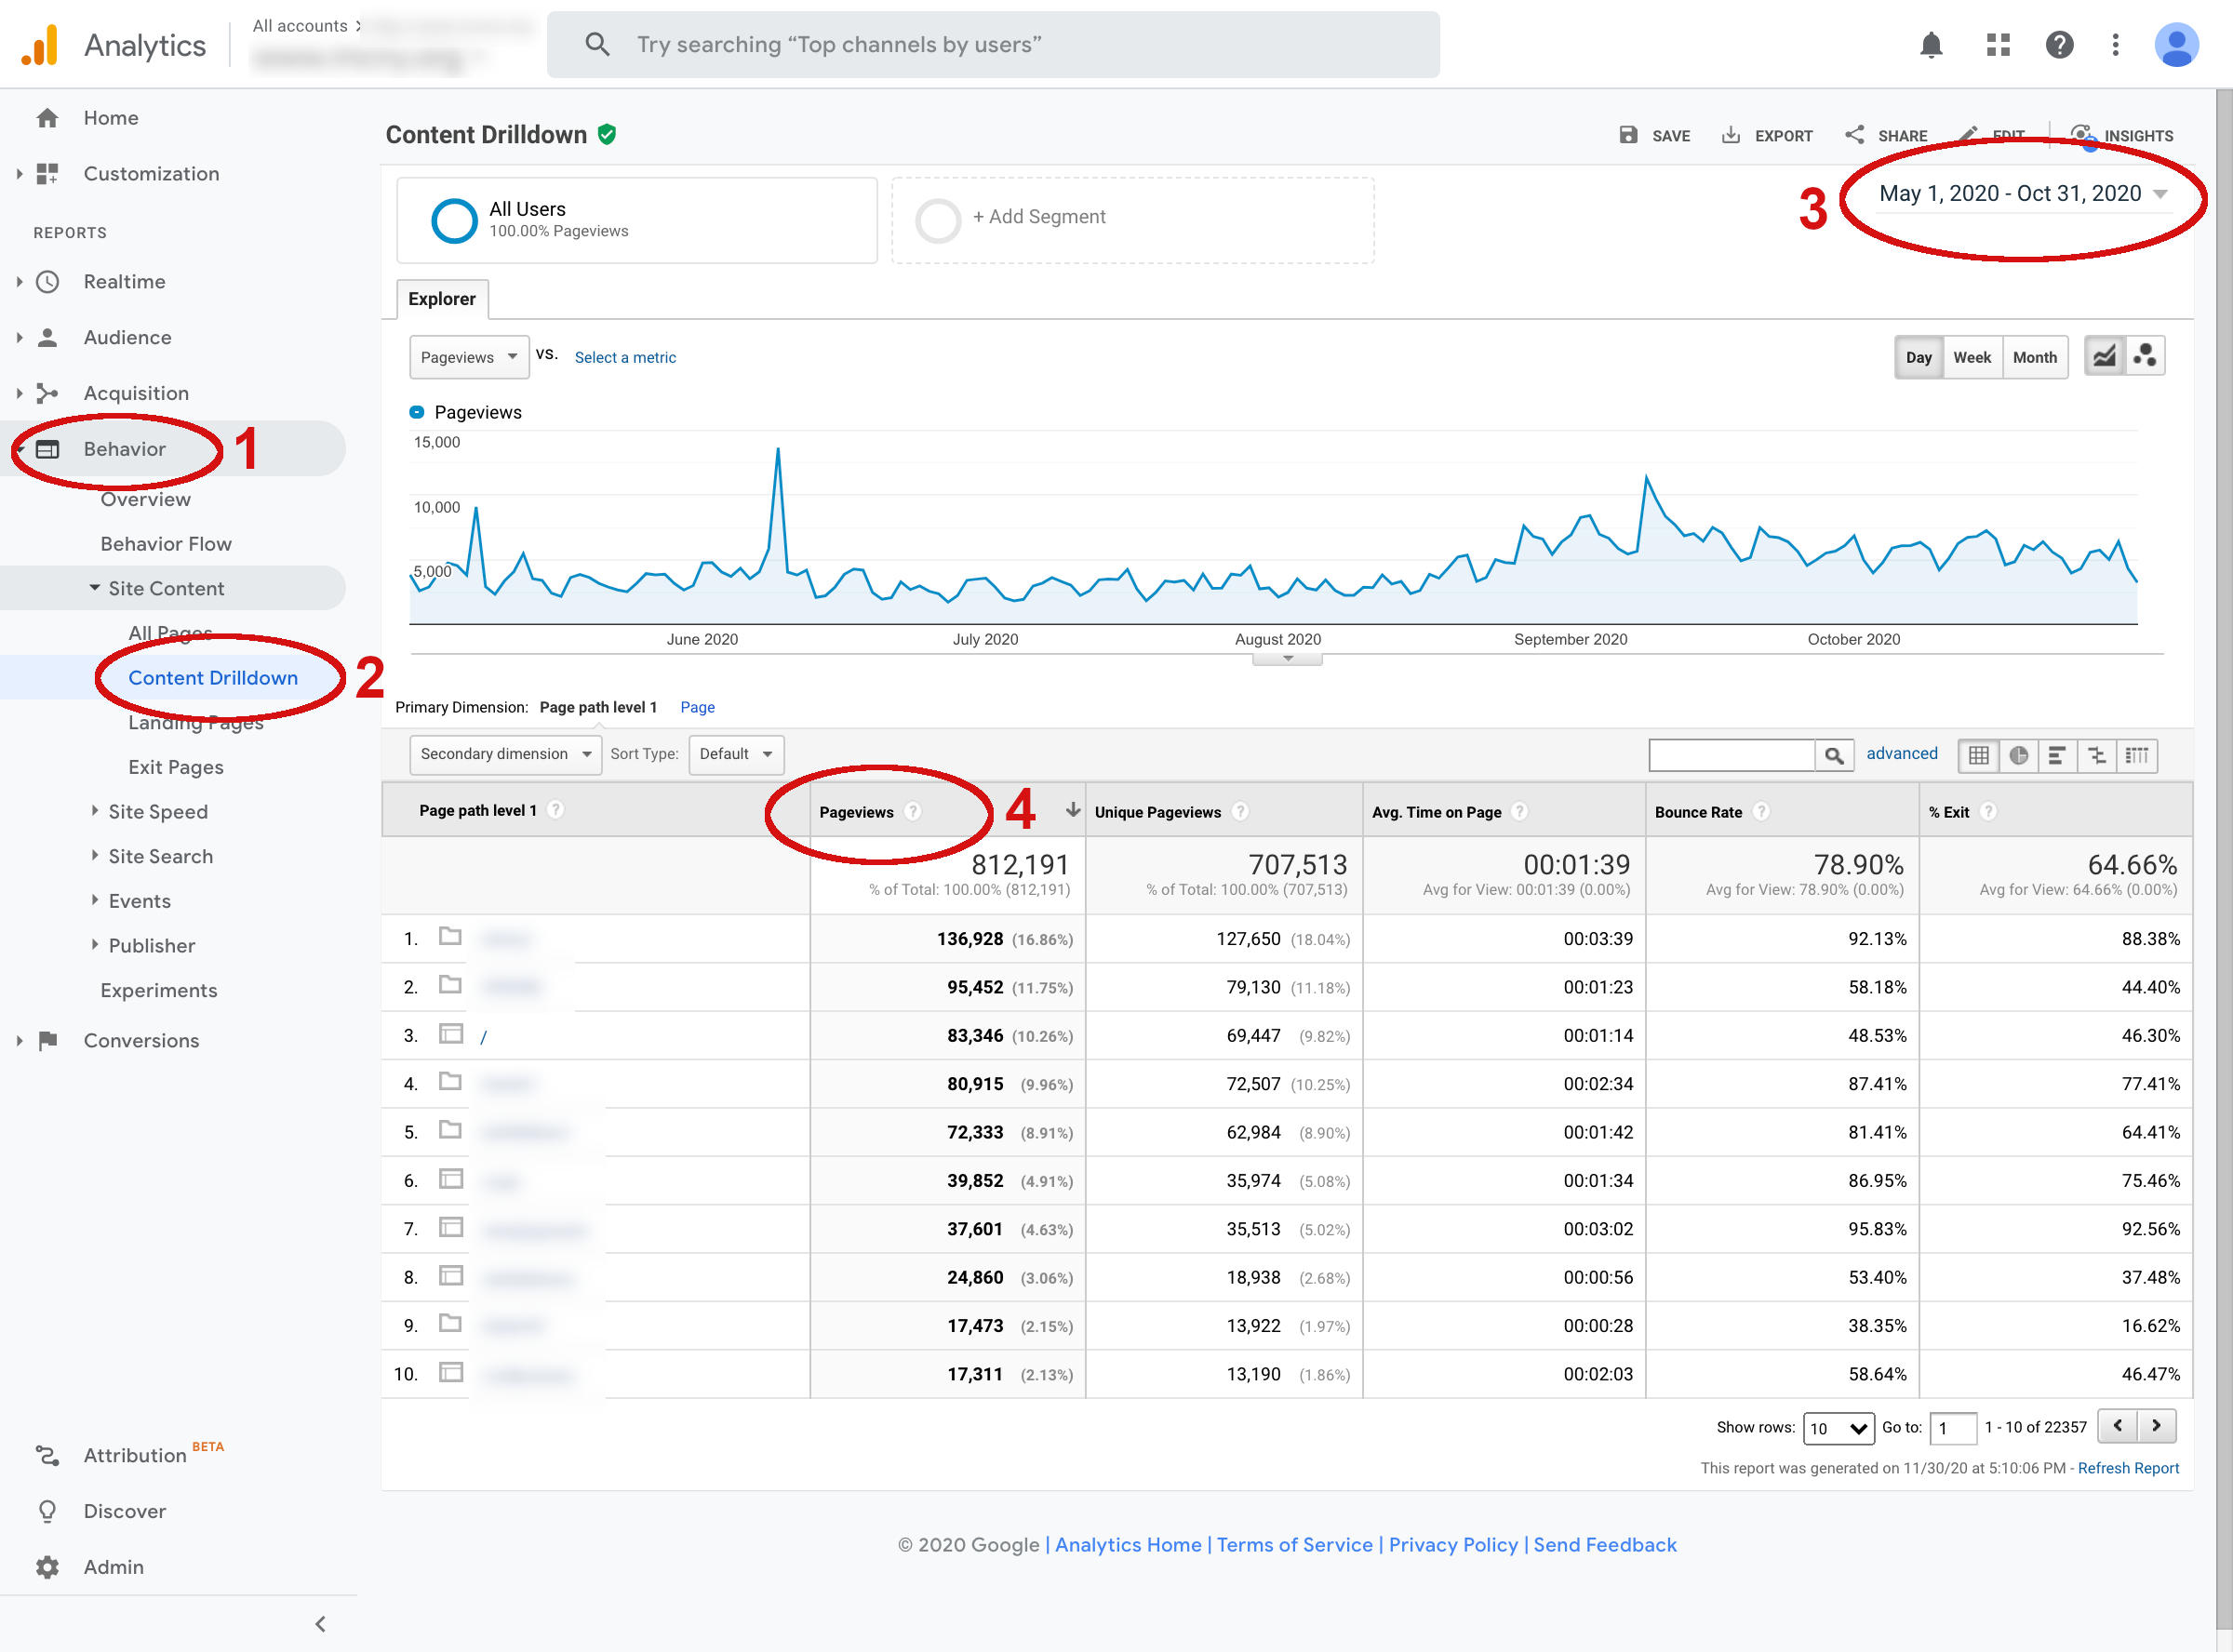
- Click on “Behavior” under “Reports” in the sidebar.
- Click on “Site Content” then “Content Drilldown.”
- Adjust the date range at the top to include the last 6 months or 12 months of data. This way your data sample will account for seasonal fluctuations or other events that can cause spikes in web traffic.
- Now look at the page paths listed. The second column “Pageviews” shows the percentage of traffic each main section receives.

3. Take a cue from pages with high engagement
Everyone wants to attract and retain the interest of visitors on their website. The more time people spend engaging with your content, the more likely they are to think highly of and support your organization. So why not see what content is performing well and try to create more content like it?
Two metrics available in Google Analytics that can indicate high-value content are average time on page and bounce rate.
Average time on page indicates how long visitors spend reading a page. While it’s true that for simple pages, a high number here could indicate confusion and usability problems, for long-form articles and substantive pages, a high average time on page is desirable.
Bounce rate indicates what percentage of visitors leave your site immediately after viewing a page, without clicking any links or engaging in other interactions. A low bounce rate indicates useful or interesting content, because the visitor was engaged enough to take further action.
When looking at the Behavior reports, you can sort by either one of these columns to see what pages perform well. I recommend limiting the results to pages with more than 100 pageviews (or an even higher number than that, depending on how much traffic your site receives). This way you won’t be misled by one-off sessions that lasted extra long or pages with unique queries or tracking codes appended.
To find the pages with high average time on page or low bounce rate, do the following:
- Click on “Behavior” under “Reports” in the sidebar.
- Click on “Site Content” then “All Pages.”
- Adjust the date range at the top to include the last 6 months or 12 months of data. This way your data sample will account for seasonal fluctuations or other events that can cause spikes in web traffic.
- In the area above the table, next to the search field, click on “Advanced” to create an advanced filter
- Create a filter to limit results to pages with over 100 pageviews by selecting “Include Site Usage > Pageviews greater than 100,” as shown in the screenshot below, and hit “Apply”.
- Now look at the pages listed. Expand the results to more than 10 pages if you want to see more examples. You can also add a second advanced filter based on Page path if you want to limit results to a certain section of your site.
- To sort by Avg. Time on Page, click on the header for that column. Be sure you are sorting from highest to lowest.
- To sort by Bounce Rate, click on the header for that column. Be sure you are sorting from lowest to highest.

Keep exploring the analytics
There are many other insights about your site visitors available in Google Analytics. It’s not helpful to get lost in data that doesn’t have relevance to your work, so before digging in further, take a few minutes to consider what would be helpful to know, or give yourself a timebox for browsing the reports. Don’t feel that you need to look at everything.
Check the Audience reports for information about where they are coming from, what kind of devices they use, and what demographics they belong to. Location info can be particularly eye-opening: do you have prospects in regions you haven’t considered? How many international viewers are coming to your site?
Drill down into the Behavior reports to see how visitors flow between pages and what kind of Events they engage in, such as downloading files, following outbound links, or clicking on calls to action. Are your header links or slideshow buttons getting clicked? Are there any specific actions you wish you could count? It may be time to add some custom dimensions or event tracking to collect more data to help you answer specific questions.
Often looking at the reports inspires new questions, and that can be a great path toward developing a tighter content strategy. You know your organization’s mission, so use these reports to help you think creatively about crafting content that will align with the interests and habits of your website visitors.
Need assistance adding Google Analytics to your site? Contact us if you’d like to see if the Four Kitchens team can help.
Making the web a better place to teach, learn, and advocate starts here...
When you subscribe to our newsletter!